For journalists, researchers and campaigners
Scotland poverty data for journalists
Lines you can lift
Pre-written, each with its source attached. Copy, paste, done.
Around 940,000 people, 17% of Scotland's population, were living in relative poverty after housing costs in 2022–25 (Scottish Government).
Three quarters of children in relative poverty in Scotland live in a household where at least one person is in paid work (Scottish Government, 2022–25).
36.1% of Glasgow's children, 39,319 children, were living in relative poverty after housing costs in 2023/24, the highest rate of any Scottish council area (End Child Poverty / Loughborough University).
Child poverty in Glasgow rose 9.0 percentage points between 2014/15 and 2023/24, the steepest rise of Scotland's 32 council areas, more than double the next steepest (End Child Poverty / Loughborough University).
A single adult working full time at the legal minimum reached only 76% of the UK's Minimum Income Standard in 2025; a lone parent with children aged 3 and 7 reached 69% (Joseph Rowntree Foundation / Loughborough University).
All four of Scotland's legally binding interim child poverty targets for 2023/24 were missed, including persistent poverty at 23% against a target of 8% (Scottish Government progress report, 2024–25).
Glasgow East has the highest constituency child poverty rate in Scotland at 34.9%; six of the seven worst Scottish seats are in Glasgow (End Child Poverty / Loughborough University, 2023/24).
In 2020/21, the one year benefits were raised, child poverty in Glasgow fell from 32.2% to 29.4%. When the £20 uplift was withdrawn it rose straight back (End Child Poverty / Loughborough University).
In 2025/26, 89% of decided Crisis Grant applications in Inverclyde resulted in an award, compared with 52% in Midlothian: a 37-percentage-point gap within the same national scheme (Scottish Government).
The Crisis Grant gap between Inverclyde and Midlothian persisted across all five years from 2021/22 to 2025/26: Inverclyde's published rate stayed between 77% and 89%, while Midlothian's stayed between 49% and 57% (Scottish Government).
Councils: worst in Scotland
One line for each measure every Scottish council reports the same way, naming the council at the bottom of it. Like-for-like, so the comparison holds up.
Perth and Kinross has the worst-maintained main roads of Scotland's 32 councils: 40.5% are flagged as needing repair, against 30.3% nationally (Local Government Benchmarking Framework, published by the Improvement Service, 2025/26).
Stirling has the most expensive bin collection in Scotland at £156 per property, against a national figure of £77.26 (Local Government Benchmarking Framework, published by the Improvement Service, 2024/25).
Stirling has the worst staff sickness rate of Scotland's 32 councils, at 18.6 days lost per employee against 14.5 days nationally (Local Government Benchmarking Framework, published by the Improvement Service, 2024/25).
Shetland Islands recycles less household waste than any other Scottish council, at 20.5% against 44.3% nationally (Local Government Benchmarking Framework, published by the Improvement Service, 2024/25).
Dumfries and Galloway has the least satisfied residents in Scotland when it comes to street cleaning: 36.0% say they are happy with it, against 57.0% nationally (Local Government Benchmarking Framework, published by the Improvement Service, 2024/25).
Held back on purpose
- Council tax collected on time is on the council pages but not in the lines above. A newer official series has overtaken it: Scottish Government Council Tax Collection Statistics 2025-26, published 17 June 2026. Use that for anything you publish.
Councils: the national picture
The 2026/27 budget round, including the part that answers the obvious question about why the gap appears every year.
31 of Scotland's 32 councils identified a budget gap when setting their 2026/27 budgets, totalling £528.6m, about 3% of their combined General Fund revenue budgets. Only South Lanarkshire reported a surplus (Audit Scotland, Local government budgets 2026/27).
Councils identified that gap despite Scottish Government revenue funding for 2026/27 being up 2% in real terms, and the gap has stayed at around the same share of budgets for seven years (Audit Scotland, Local government budgets 2026/27).
Increasing council tax was the single largest measure councils used to close their 2026/27 budget gaps, raising £221m, more than the £168m they expected from savings that recur each year (Audit Scotland, Local government budgets 2026/27).
Every Scottish council raised council tax for 2026/27, by an average of 7.7% and ranging from 4% in City of Edinburgh to 10% in Aberdeenshire and Moray. It was the second consecutive year of increases, 18% cumulatively (Audit Scotland, Local government budgets 2026/27).
The local government grant is distributed on need (population, pupil numbers, deprivation and road length) using indicators the Scottish Parliament's own research service describes as "outside of the control of Local Authorities". Past spending is not the basis for allocation, so a council that underspends does not receive less the following year (SPICe briefing SB-1860).
New investigation · 2025/26
The 37-point Crisis Grant postcode gap
The disparity involves thousands of decisions and persists across five years. The figures show different outcomes, not their cause, so the reporting pack includes the questions councils need to answer and every methodological caveat.
Primary source: Scottish Government, Scottish Welfare Fund statistics to 31 March 2026.
Or take a whole pack for one council
Headline, figures, sources, notes to editors and the citation. Generated from the data, so it is never out of step with the record it points at.
Aberdeen City: 19.1% of children in poverty, and a council budget gap
Figures for Aberdeen City Council from the Local Government Benchmarking Framework, Audit Scotland and End Child Poverty, with sources and the underlying file.
Figures
19.1% of children in Aberdeen City were living in relative poverty after housing costs in 2023/24, which is 7,825 children. The figure across Scotland was 23.3%.
End Child Poverty / Loughborough University, 2023/24
Child poverty in Aberdeen City rose by 0.4 percentage points between 2014/15 and 2023/24.
End Child Poverty / Loughborough University, 2014/15 to 2023/24
Aberdeen City Council identified a budget gap of £11m when setting its 2026/27 budget. 31 of Scotland's 32 councils identified a gap, totalling £528.6m.
Local government budgets 2026/27, Audit Scotland, for the Accounts Commission, June 2026
Every Scottish council raised council tax for 2026/27, by an average of 7.7%. It was the second consecutive year of increases, 18% over the two years together.
Local government budgets 2026/27, Audit Scotland, for the Accounts Commission, June 2026
Notes to editors
- Councils work out and describe their budget gap in different ways, so these figures are not a perfect like-for-like comparison. Audit Scotland says comparisons should be made with caution.
- Council tax collected on time is left out of this pack because a newer official series has overtaken the benchmarking file: Scottish Government Council Tax Collection Statistics 2025-26, published 17 June 2026.
Show it as plain text
Aberdeen City: 19.1% of children in poverty, and a council budget gap

Figures for Aberdeen City Council from the Local Government Benchmarking Framework, Audit Scotland and End Child Poverty, with sources and the underlying file.

FIGURES
- 19.1% of children in Aberdeen City were living in relative poverty after housing costs in 2023/24, which is 7,825 children. The figure across Scotland was 23.3%. (End Child Poverty / Loughborough University, 2023/24)
- Child poverty in Aberdeen City rose by 0.4 percentage points between 2014/15 and 2023/24. (End Child Poverty / Loughborough University, 2014/15 to 2023/24)
- Aberdeen City Council identified a budget gap of £11m when setting its 2026/27 budget. 31 of Scotland's 32 councils identified a gap, totalling £528.6m. (Local government budgets 2026/27, Audit Scotland, for the Accounts Commission, June 2026)
- Every Scottish council raised council tax for 2026/27, by an average of 7.7%. It was the second consecutive year of increases, 18% over the two years together. (Local government budgets 2026/27, Audit Scotland, for the Accounts Commission, June 2026)

NOTES TO EDITORS
- Councils work out and describe their budget gap in different ways, so these figures are not a perfect like-for-like comparison. Audit Scotland says comparisons should be made with caution.
- Council tax collected on time is left out of this pack because a newer official series has overtaken the benchmarking file: Scottish Government Council Tax Collection Statistics 2025-26, published 17 June 2026.

ABOUT
Independent public data for Scotland. Scotland Counted publishes what the official record shows about poverty, work, pay and living costs in every Scottish council area, with the source and the working set out beside each figure. It is written and published by Graeme. No party affiliation, no funding and no paywall.

Full record: https://scotlandcounted.org.uk/councils/aberdeen-city
Underlying data: https://scotlandcounted.org.uk/data/scottish-councils-benchmarks.csv
Cite as: Scotland Counted, scotlandcounted.org.uk
Questions and corrections: https://scotlandcounted.org.uk/contact
How to credit it
Scotland Counted, scotlandcounted.org.uk
That is all that is needed. The underlying figures belong to the Improvement Service and Audit Scotland, and citing them directly is welcome too, every council page links to the exact document behind each number.
A local link for every Scottish story
Link readers to the place in the story, not a generic homepage. Each local page carries its own share control, source trail and direct route to the representatives who can act.
The one-page summary
Portrait, made for a phone screen and for social posts. Free to reuse with credit.
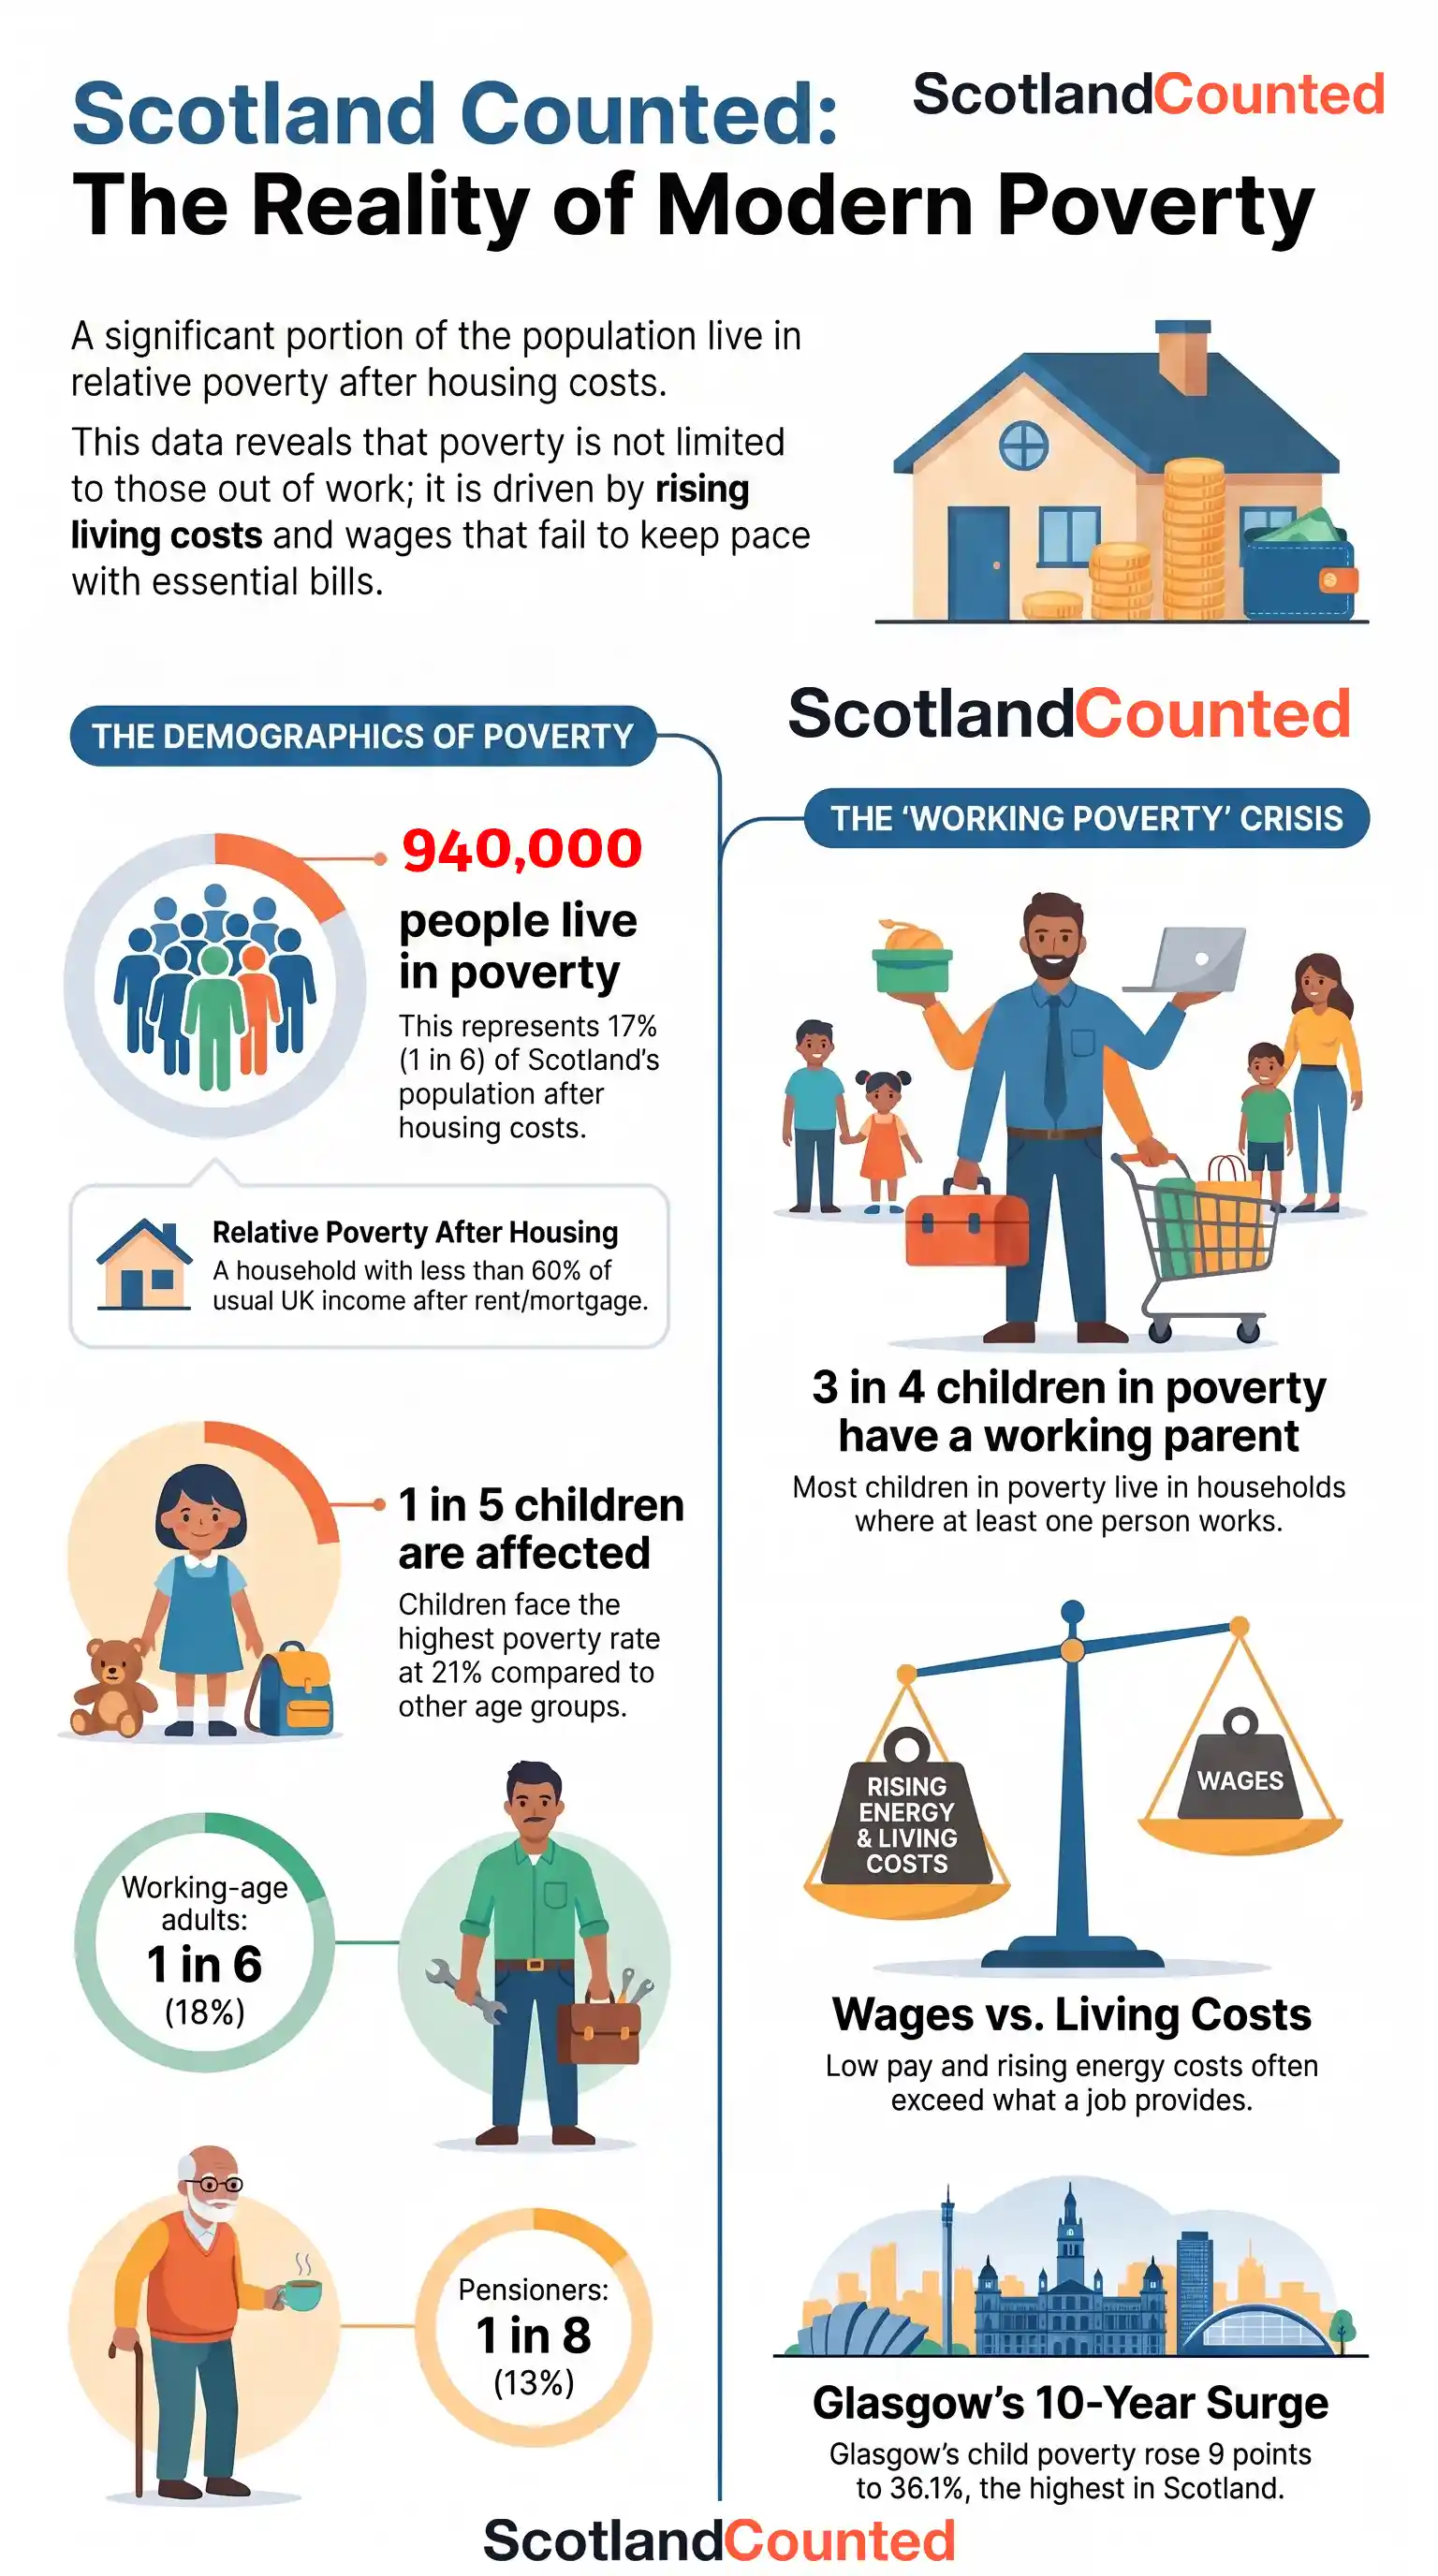 The reality of modern poverty in ScotlandWebP · 1536×2752 · 148 KBPoverty rates for all people, children, working-age adults and pensioners, the working-poverty figure, and Glasgow's ten-year rise.↓ Download
Charts as images
1200×630 PNG cards, drawn from the same data as the live charts. Right-click and save, or link directly.
Live embeds
The four Glasgow time-series charts can be embedded with an iframe and stay current as the data updates. The embed button sits under each supported chart on the indicator pages. For example, point an iframe at https://scotlandcounted.org.uk/embed/glasgow-child-poverty.
About, in one paragraph
Scotland Counted (scotlandcounted.org.uk) is an independent evidence-to-action service covering poverty, work and living standards across all 32 Scottish council areas and all 57 Scottish Westminster constituencies, with Glasgow as its detailed historical case study. Built from ONS, DWP, Scottish Government and academic data, it finds a reader's MP and MSP and prepares addressed emails without storing the postcode. It is written and published by Graeme of Strathmark Consulting, with no party affiliation or funding.
Reuse terms
Charts, stat lines and analysis: free for any use with attribution to Scotland Counted. The underlying data belongs to its original publishers, almost all under the Open Government Licence, sources here, raw files here.
Interviews, data requests or a series in a different shape: the contact form. If you are on a deadline, say so in the first line, those get read first.
Something here wrong? That outranks everything
A public correction beats a citation. If a figure does not match its source, report it and it will be fixed and logged the same day.
One simple next step