Scotland's shoplifting rate overtakes England and Wales as convictions nearly halve
Shoplifting in Scotland is at its highest since 1971 and now higher per person than in England and Wales. Convictions have nearly halved. Food prices explain much of the surge, but not the last two years.
By Graeme · 28 September 2026 · 13 min read
On this page
Scotland now has more shoplifting per person than England and Wales, by the biggest margin in figures going back to 2002. Police recorded 53,369 shoplifting crimes in 2025-26, the most since records began in 1971. Over the same years, the number of shoplifters in court has nearly halved.
We went through 30 years of police figures, court records, food prices and data for all 32 councils to find out what is going on. Some of it fits the cost of living story. Some of it does not.
Four things the figures show
53,369
shoplifting crimes recorded in 2025-26
Highest since 1971 · up 74% from 30,688 in 2019-20
17% higher
shoplifting rate than England and Wales
9.6 against 8.2 crimes per 1,000 people · Scotland's biggest lead since at least 2002
47% fewer
people convicted of shoplifting
5,422 in 2019-20 · 2,854 in 2023-24, the latest year published
10,595
shoplifting crimes in Edinburgh, more than Glasgow's 9,722
Glasgow had more every year from 1996 until Covid
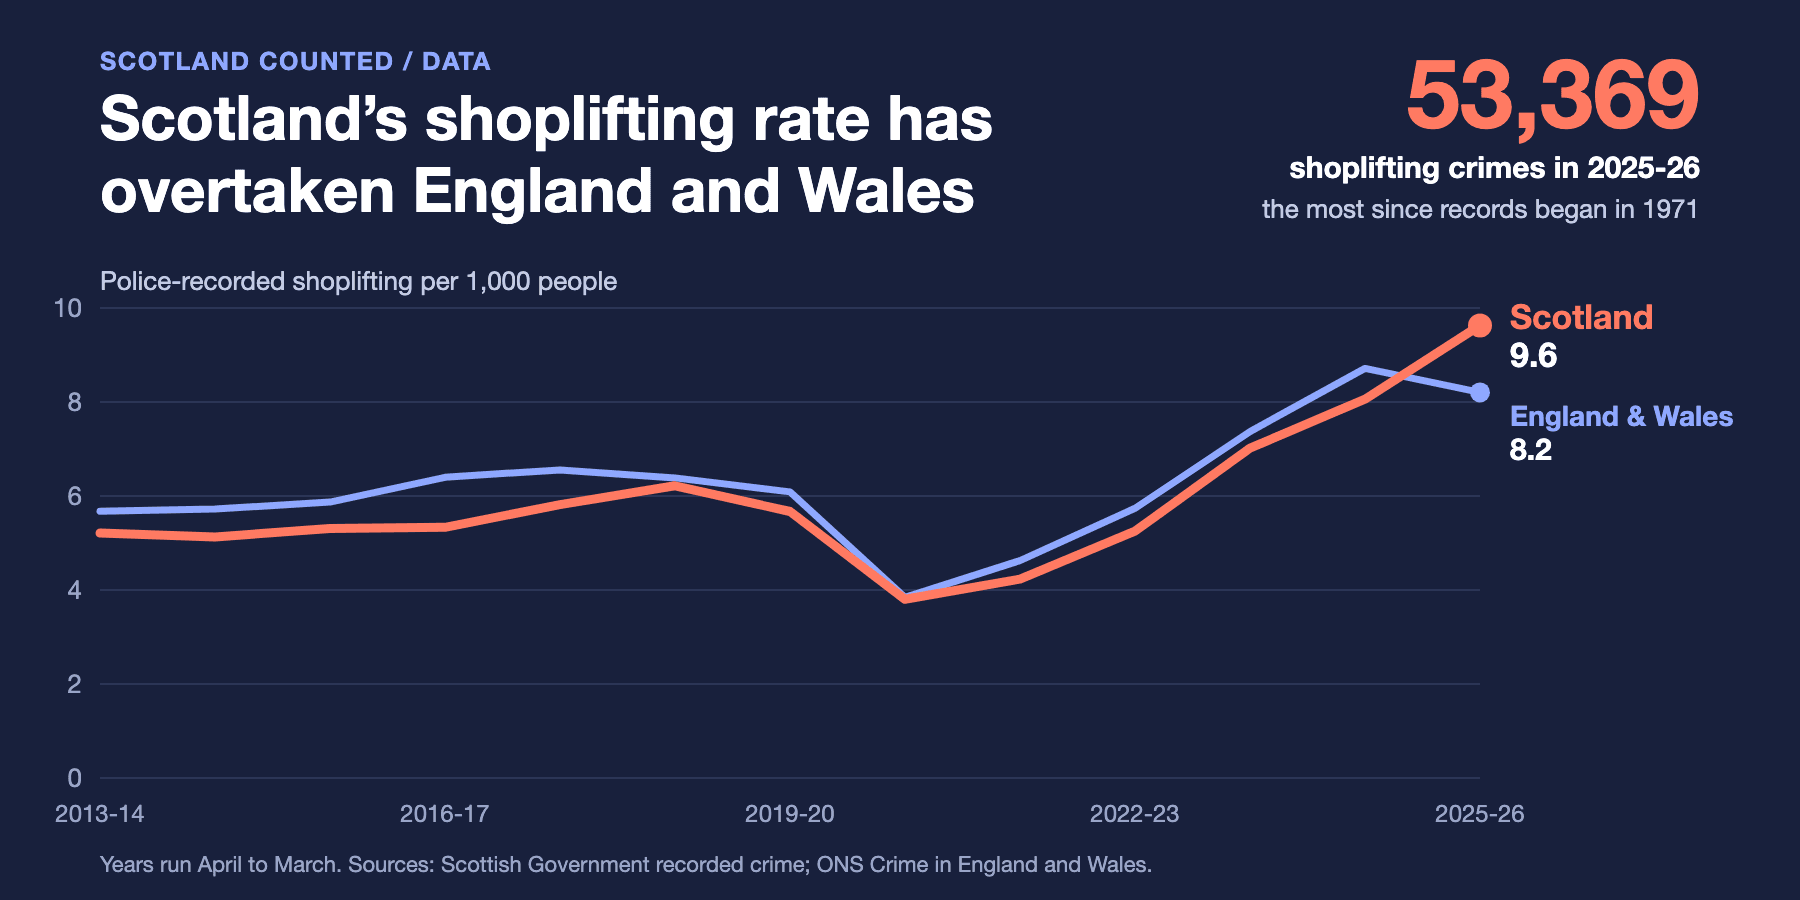
Scotland has overtaken England and Wales
Scotland's shoplifting rate has overtaken England and Wales
Police-recorded shoplifting per 1,000 people · years run April to March
See the numbers behind this chart
| Year | Scotland | England and Wales | Scotland crimes | England and Wales crimes |
|---|---|---|---|---|
| 2013-14 | 5.21 | 5.67 | 27,693 | 321,065 |
| 2014-15 | 5.13 | 5.72 | 27,364 | 326,053 |
| 2015-16 | 5.31 | 5.87 | 28,424 | 337,251 |
| 2016-17 | 5.33 | 6.40 | 28,650 | 370,294 |
| 2017-18 | 5.82 | 6.56 | 31,321 | 382,649 |
| 2018-19 | 6.22 | 6.38 | 33,523 | 374,789 |
| 2019-20 | 5.67 | 6.09 | 30,688 | 359,245 |
| 2020-21 | 3.80 | 3.85 | 20,557 | 228,107 |
| 2021-22 | 4.23 | 4.63 | 22,913 | 274,933 |
| 2022-23 | 5.25 | 5.74 | 28,619 | 342,378 |
| 2023-24 | 7.02 | 7.37 | 38,674 | 443,959 |
| 2024-25 | 8.06 | 8.71 | 44,730 | 530,324 |
| 2025-26 | 9.63 | 8.20 | 53,369 | 507,086 |
Before Covid, Scotland had less shoplifting per person: 5.7 crimes per 1,000 people against 6.1 in England and Wales. Both rose sharply after 2022. Then they split. In 2025-26, shoplifting in England and Wales fell by 4%. In Scotland it rose by 19%.
England and Wales also had the “£200 rule” from 2014, which critics said made low-value theft a lower priority. Scotland never had it. Yet Scotland's rise has been bigger.
A record, and it is almost all shoplifting
Recorded shoplifting in Scotland, 1996-97 to 2025-26
Crimes per year, in thousands · years run April to March
See the numbers behind this chart
| Year | Shoplifting | All other theft and dishonesty |
|---|---|---|
| 1996-97 | 26,174 | 259,611 |
| 1997-98 | 26,984 | 239,902 |
| 1998-99 | 30,766 | 246,208 |
| 1999-00 | 32,144 | 243,413 |
| 2000-01 | 32,264 | 221,031 |
| 2001-02 | 31,570 | 211,308 |
| 2002-03 | 28,299 | 196,486 |
| 2003-04 | 27,948 | 183,056 |
| 2004-05 | 28,534 | 181,831 |
| 2005-06 | 28,247 | 159,551 |
| 2006-07 | 28,750 | 155,010 |
| 2007-08 | 29,186 | 137,532 |
| 2008-09 | 32,048 | 135,764 |
| 2009-10 | 30,332 | 122,924 |
| 2010-11 | 29,660 | 126,210 |
| 2011-12 | 29,758 | 124,579 |
| 2012-13 | 26,449 | 109,450 |
| 2013-14 | 27,693 | 109,631 |
| 2014-15 | 27,364 | 99,493 |
| 2015-16 | 28,424 | 87,365 |
| 2016-17 | 28,650 | 84,555 |
| 2017-18 | 31,321 | 83,153 |
| 2018-19 | 33,523 | 80,983 |
| 2019-20 | 30,688 | 80,721 |
| 2020-21 | 20,557 | 69,174 |
| 2021-22 | 22,913 | 69,960 |
| 2022-23 | 28,619 | 74,774 |
| 2023-24 | 38,674 | 72,380 |
| 2024-25 | 44,730 | 66,183 |
| 2025-26 | 53,369 | 64,671 |
The old high was 33,523 in 2018-19. The 2025-26 figure is 59% above it. Shoplifting now makes up 45% of all theft and dishonesty crime in Scotland. In 2019-20 it was 28%.
Almost everything else in the same crime group went the other way:
| Crime | 2019-20 | 2025-26 | Change |
|---|---|---|---|
| Shoplifting | 30,688 | 53,369 | +74% |
| Other theft | 41,421 | 30,320 | −27% |
| Fraud | 11,939 | 15,364 | +29% |
| Housebreaking | 12,903 | 6,968 | −46% |
| Theft of a motor vehicle | 5,002 | 4,898 | −2% |
| Other dishonesty | 4,746 | 4,369 | −8% |
| Theft from a motor vehicle | 2,982 | 1,537 | −48% |
| Theft by opening lockfast places | 1,728 | 1,215 | −30% |
Add the other seven types together and they fell by 20%, from 80,721 to 64,671. Break-ins to homes and other buildings are at their lowest level since 1971.
Shoplifting went one way. Other theft went the other.
Recorded crimes, indexed so that 2019-20 = 100
See the numbers behind this chart
| Year | Shoplifting | Other theft | Housebreaking |
|---|---|---|---|
| 2013-14 | 90.2 | 141.9 | 172.6 |
| 2014-15 | 89.2 | 129.3 | 159.7 |
| 2015-16 | 92.6 | 112.1 | 136.7 |
| 2016-17 | 93.4 | 109.1 | 126.3 |
| 2017-18 | 102.1 | 107.3 | 117.3 |
| 2018-19 | 109.2 | 103.5 | 106.8 |
| 2019-20 | 100 | 100 | 100 |
| 2020-21 | 67 | 77.3 | 75.2 |
| 2021-22 | 74.7 | 80.4 | 65.8 |
| 2022-23 | 93.3 | 89.5 | 68.2 |
| 2023-24 | 126 | 82.8 | 70 |
| 2024-25 | 145.8 | 77 | 57.2 |
| 2025-26 | 173.9 | 73.2 | 54 |
Why shops, and not homes?
Some people point to the fall in other theft as proof that hardship is not behind this. That does not follow. Taking food from a big supermarket is a very different act from breaking into a home. It is quick. The chance of being stopped is low. The food can be eaten the same day. Breaking into a home means a victim, a real risk of violence and a long prison sentence. Someone under money pressure might do the first and never the second.
Shops have changed too. In a December 2024 report, Police Scotland listed self-service tills, fewer staff and shops' “non-confrontation” policies among the things driving retail theft. Many big retailers tell staff not to tackle shoplifters, to keep them safe. Those are the shops' own rules. We found no government policy telling staff to let thieves walk out.
What Police Scotland says is driving it
Its report to the Scottish Police Authority names six things: the cost of living crisis, serious organised crime, changes in shops, the criminal justice system, peer pressure, and mental health and addiction. It found 36.7% of shoplifters committed more than one shoplifting in the year. And 663 thirteen-year-olds were named in shoplifting crimes in 2023-24, 61% more than in 2019-20.
Fewer shoplifters are being convicted
Research on crime finds that the chance of being caught matters more than how harsh the punishment is. On that measure, the trend in Scotland is stark.
Fewer shoplifting crimes are solved, and far fewer lead to a
Scotland · share of recorded shoplifting solved by police, and people per 100 crimes recorded
See the numbers behind this chart
| Year | Recorded | Solved | Convicted | Per 100 | Jailed | Average jail term |
|---|---|---|---|---|---|---|
| 2014-15 | 27,364 | 74.6% | 6,942 | 25.4 | 30.6% | 116 days |
| 2015-16 | 28,424 | 72.9% | 6,596 | 23.2 | 28.5% | 115 days |
| 2016-17 | 28,650 | 71.6% | 6,248 | 21.8 | 26.1% | 119 days |
| 2017-18 | 31,321 | 67.4% | 5,661 | 18.1 | 26.4% | 119 days |
| 2018-19 | 33,523 | 67.4% | 5,928 | 17.7 | 30.8% | 118 days |
| 2019-20 | 30,688 | 66.3% | 5,422 | 17.7 | 26.3% | 121 days |
| 2020-21 | 20,557 | 65.7% | 2,678 | 13.0 | 23.1% | 127 days |
| 2021-22 | 22,913 | 56% | 2,704 | 11.8 | 23.6% | 123 days |
| 2022-23 | 28,619 | 53.5% | 3,004 | 10.5 | 28.2% | 116 days |
| 2023-24 | 38,674 | 50.3% | 2,854 | 7.4 | 31.5% | 121 days |
| 2024-25 | 44,730 | 49% | Not yet published | – | – | – |
| 2025-26 | 53,369 | 50.6% | Not yet published | – | – | – |
In 2019-20, 5,422 people were with shoplifting as their main crime. In 2023-24 it was 2,854, even though recorded shoplifting had risen by a quarter. For every 100 shoplifting crimes recorded, about 18 people were in 2019-20. By 2023-24 it was about 7. A decade earlier, in 2014-15, it was 25.
Police solve a smaller share too: 74.6% in 2014-15, 66.3% in 2019-20, and about half every year since 2022-23. In fairness, officers are solving more cases than before, roughly 27,000 in 2025-26 against 20,300 in 2019-20. They have not kept pace with the rise.
The people who are are not being let off more lightly. The share sent to prison rose from 26.3% in 2019-20 to 31.5% in 2023-24, and the average prison sentence stayed at about four months. What has changed is how many people are caught and in the first place.
A council-by-council check
If a falling chance of getting caught leads to more theft, the places where it fell most should later see the biggest rises. We checked. Councils where the solved rate fell most between 2019-20 and 2021-22 did go on to see bigger shoplifting rises up to 2025-26. The link is moderate and unlikely to be chance. But it weakens a lot if you pick slightly different years. Treat it as a hint, not proof.
What changed in policing, courts and prisons
July 2019: courts must avoid prison sentences of 12 months or less unless nothing else is suitable. The limit had been three months.
2020–2022: Covid closes courts for long spells and leaves a large backlog.
May–June 2024: Police Scotland rolls out its “proportionate response to crime”. Low-risk crimes with no leads can be closed without investigation. Police would not say how many were shoplifting.
June–July 2024: 477 prisoners released early to ease overcrowding.
February 2025: short-term prisoners released after 40% of their sentence instead of 50%.
April 2025: a police Retail Crime Taskforce starts work, funded with £3 million a year.
November 2025 to April 2026: 614 more prisoners released early.
December 2025: a faster court process extended to shoplifting cases.
May 2026: the release point moves to 30% of the sentence.
The early releases cover all short-term prisoners. The published figures do not say how many were shoplifters, so their effect on shoplifting cannot be measured yet.
Edinburgh has overtaken Glasgow
Edinburgh now records more shoplifting than Glasgow
Recorded shoplifting crimes per year, in thousands
See the numbers behind this chart
| Year | Edinburgh | Glasgow |
|---|---|---|
| 1996-97 | 3,796 | 5,332 |
| 1997-98 | 3,671 | 6,189 |
| 1998-99 | 3,920 | 7,688 |
| 1999-00 | 4,062 | 7,377 |
| 2000-01 | 3,951 | 7,847 |
| 2001-02 | 3,800 | 6,911 |
| 2002-03 | 3,274 | 6,248 |
| 2003-04 | 3,197 | 5,237 |
| 2004-05 | 3,194 | 5,319 |
| 2005-06 | 3,275 | 5,199 |
| 2006-07 | 3,361 | 4,989 |
| 2007-08 | 3,553 | 5,564 |
| 2008-09 | 4,448 | 6,166 |
| 2009-10 | 3,956 | 5,898 |
| 2010-11 | 3,649 | 5,546 |
| 2011-12 | 3,609 | 6,330 |
| 2012-13 | 3,194 | 5,339 |
| 2013-14 | 3,371 | 5,708 |
| 2014-15 | 3,138 | 5,421 |
| 2015-16 | 3,499 | 5,500 |
| 2016-17 | 3,757 | 5,421 |
| 2017-18 | 4,223 | 5,615 |
| 2018-19 | 4,760 | 5,340 |
| 2019-20 | 3,969 | 4,573 |
| 2020-21 | 2,597 | 2,418 |
| 2021-22 | 3,040 | 2,902 |
| 2022-23 | 3,557 | 4,018 |
| 2023-24 | 5,747 | 5,553 |
| 2024-25 | 8,007 | 7,475 |
| 2025-26 | 10,595 | 9,722 |
Edinburgh's shoplifting rose from 3,969 crimes in 2019-20 to 10,595 in 2025-26, up 167%. Glasgow's rose from 4,573 to 9,722, up 113%. The two cities alone make up more than half of Scotland's whole increase.
They also have some of the lowest solved rates. Police solved 38.4% of shoplifting in Edinburgh in 2025-26, down from 53.1% in 2019-20. Only East Lothian was lower, at 33.0%. In Glasgow it was 39.3%, down from 57.0%.
Across the country, shoplifting rose in 29 of the 32 council areas. The typical council saw a rise of 56%. Dundee has the highest rate for its size.
Figure 6 · Find your council
The ten highest shoplifting rates
Per 10,000 people · 2025-26
95.1 in 2019-20 · crimes +125% · 47.4% solved
78.1 in 2019-20 · crimes +167% · 38.4% solved
74.7 in 2019-20 · crimes +113% · 39.3% solved
61.9 in 2019-20 · crimes +127% · 68.8% solved
89.3 in 2019-20 · crimes +24% · 50.5% solved
58.1 in 2019-20 · crimes +81% · 69.1% solved
64.8 in 2019-20 · crimes +55% · 54.5% solved
53.5 in 2019-20 · crimes +82% · 40.5% solved
77.7 in 2019-20 · crimes +17% · 70.3% solved
68.2 in 2019-20 · crimes +37% · 39.1% solved
56.7 in 2019-20 · crimes +74% · 50.6% solved
See all 32 councils
| Council area | 2019-20 | 2025-26 | Change | Per 10,000 | Solved |
|---|---|---|---|---|---|
| Dundee City | 1,410 | 3,174 | +125% | 211.8 | 47.4% |
| City of Edinburgh | 3,969 | 10,595 | +167% | 199.6 | 38.4% |
| Glasgow City | 4,573 | 9,722 | +113% | 149.5 | 39.3% |
| Inverclyde | 490 | 1,111 | +127% | 140.7 | 68.8% |
| Aberdeen City | 1,989 | 2,469 | +24% | 106.5 | 50.5% |
| Fife | 2,152 | 3,902 | +81% | 104.1 | 69.1% |
| West Dunbartonshire | 580 | 901 | +55% | 101.1 | 54.5% |
| West Lothian | 961 | 1,746 | +82% | 93.7 | 40.5% |
| East Ayrshire | 939 | 1,101 | +17% | 90.6 | 70.3% |
| Midlothian | 637 | 873 | +37% | 87.4 | 39.1% |
| South Ayrshire | 925 | 951 | +3% | 84.8 | 70.6% |
| North Ayrshire | 724 | 1,131 | +56% | 84.5 | 70.5% |
| Renfrewshire | 977 | 1,574 | +61% | 83.1 | 51.8% |
| Perth and Kinross | 661 | 1,194 | +81% | 77.4 | 53.9% |
| South Lanarkshire | 1,780 | 2,545 | +43% | 76.2 | 54.8% |
| East Lothian | 476 | 830 | +74% | 72.0 | 33% |
| North Lanarkshire | 2,121 | 2,365 | +12% | 68.6 | 62.7% |
| Clackmannanshire | 215 | 354 | +65% | 67.9 | 70.6% |
| Angus | 273 | 756 | +177% | 65.8 | 66.3% |
| Falkirk | 833 | 1,046 | +26% | 65.3 | 46.2% |
| East Dunbartonshire | 295 | 631 | +114% | 57.5 | 51.3% |
| Highland | 919 | 1,152 | +25% | 48.6 | 72.7% |
| Moray | 226 | 448 | +98% | 47.2 | 73.9% |
| Dumfries and Galloway | 672 | 626 | −7% | 42.9 | 77% |
| Stirling | 352 | 398 | +13% | 42.2 | 52.5% |
| Scottish Borders | 313 | 444 | +42% | 38.0 | 58.3% |
| East Renfrewshire | 178 | 336 | +89% | 33.7 | 44.9% |
| Aberdeenshire | 799 | 712 | −11% | 26.9 | 65.9% |
| Argyll and Bute | 150 | 207 | +38% | 23.6 | 68.6% |
| Orkney Islands | 30 | 34 | +13% | 15.5 | 91.2% |
| Na h-Eileanan Siar | 21 | 35 | +67% | 13.5 | 85.7% |
| Shetland Islands | 48 | 6 | −88% | 2.6 | 66.7% |
Is it worst in the poorest places?
If people are stealing to get by, you might expect the rise to be biggest in poorer areas. We tested that several ways.
- Poorer areas have more shoplifting per person. That was true before the price rises and it is still true. The strength of the link has barely changed.
- The rise itself was not bigger in poorer areas. We split councils into three groups by child poverty before the crisis. Shoplifting rose 87% in the least poor group, 59% in the middle and 64% in the poorest. Edinburgh drives the least poor group. Leave out the four big cities and the poorest group rose least, by 34%.
- Where child poverty got worse, shoplifting rose more. This link is moderate, but it leans on Glasgow and Edinburgh and weakens without them.
- Changes in Crisis Grant applications showed no link with changes in shoplifting.
The rise happened in richer and poorer areas alike
Shoplifting per 10,000 people · councils grouped into thirds by child poverty in 2019-20
See the numbers behind this chart
| Year | Poorest third | Middle third | Least poor third |
|---|---|---|---|
| 2013-14 | 63.3 | 39.4 | 47.5 |
| 2014-15 | 64.1 | 34.8 | 47.9 |
| 2015-16 | 64 | 36.5 | 52.5 |
| 2016-17 | 62.2 | 38.3 | 54 |
| 2017-18 | 67.2 | 44.4 | 57.5 |
| 2018-19 | 70.3 | 49.7 | 61.6 |
| 2019-20 | 66.2 | 43.5 | 55.1 |
| 2020-21 | 41.2 | 32.8 | 38.1 |
| 2021-22 | 47.2 | 34.7 | 42.3 |
| 2022-23 | 64.2 | 39.4 | 48.1 |
| 2023-24 | 82.3 | 54.6 | 67.2 |
| 2024-25 | 88.9 | 64.8 | 82.8 |
| 2025-26 | 108.3 | 69 | 103 |
The technical detail
Poorest third: Clackmannanshire, Dumfries and Galloway, Dundee City, East Ayrshire, Falkirk, Fife, Glasgow City, North Ayrshire, North Lanarkshire, South Ayrshire, West Dunbartonshire.
Middle third: Angus, Argyll and Bute, East Lothian, Highland, Inverclyde, Midlothian, Moray, Scottish Borders, South Lanarkshire, West Lothian.
Least poor third: Aberdeen City, Aberdeenshire, City of Edinburgh, East Dunbartonshire, East Renfrewshire, Na h-Eileanan Siar, Orkney Islands, Perth and Kinross, Renfrewshire, Shetland Islands, Stirling.
Tests across the 32 councils used rank correlations with 20,000 random shuffles. Rise from 2019-20 against child poverty: 0.28, could easily be chance. Level in 2025-26 against child poverty: 0.56, very unlikely to be chance. Rise against the change in child poverty: 0.44, about 1 in 100 by chance, falling to 0.32 once the four cities and three island councils are removed.
Solved-rate test: the fall in the solved rate from 2019-20 to 2021-22 against the rise in shoplifting from 2021-22 to 2025-26 gives −0.40 (about 2 in 100 by chance), or −0.47 without the island councils. It holds after allowing for the Covid bounce-back, but falls to −0.21 using 2022-23 as the split year.
One big caution. Shoplifting is counted where the shop is, not where the thief lives. City centres and retail parks draw people from far and wide, including organised gangs. So council figures are only a rough guide to local need.
Food prices explain the surge, up to a point
UK food prices rose 39% between April 2021 and March 2026. The yearly rise peaked at 19.2% in March 2023. If people are stealing because they cannot afford food, shoplifting should rise fastest when prices rise fastest. That is what we tested.
In years when food prices rose faster, shoplifting rose faster
Change on the year before · UK food prices (April to March average) and recorded shoplifting in Scotland
2013-14
2014-15
2015-16
2016-17
2017-18
2018-19
2019-20
2020-21 · Covid
2021-22 · Covid
2022-23
2023-24
2024-25
2025-26
See the numbers behind this chart
| Year | Food prices | Shoplifting |
|---|---|---|
| 2013-14 | +3.2% | +4.7% |
| 2014-15 | −1.4% | −1.2% |
| 2015-16 | −2.5% | +3.9% |
| 2016-17 | −1.7% | +0.8% |
| 2017-18 | +2.9% | +9.3% |
| 2018-19 | +1.5% | +7.0% |
| 2019-20 | +1.5% | −8.5% |
| 2020-21 (Covid) | +0.1% | −33.0% |
| 2021-22 (Covid) | +1.8% | +11.5% |
| 2022-23 | +14.1% | +24.9% |
| 2023-24 | +11.3% | +35.1% |
| 2024-25 | +2.2% | +15.7% |
| 2025-26 | +4.3% | +19.3% |
The technical detail
Correlation across the 11 non-Covid years from 2013-14 to 2025-26: 0.82. We shuffled the years 20,000 times; a link this strong turned up by chance about 2 times in 1,000. Dropping any single year leaves it between 0.75 and 0.88. Dropping both big crisis years (2022-23 and 2023-24) leaves 0.56.
A straight line fitted to the non-Covid years up to 2023-24 gives: shoplifting growth ≈ 2% + 2 × food price growth. It predicts rises of 6.4% in 2024-25 and 10.6% in 2025-26. The recorded rises were 15.7% and 19.3%.
For most of the period, the fit is strong. The biggest jumps in shoplifting, 25% in 2022-23 and 35% in 2023-24, came exactly when food prices were rising fastest. Across 11 years, leaving out the two Covid years, the match between the two scores 0.82 on a scale where 1 is a perfect match. A match that close would happen by chance only about 2 times in 1,000.
Then it breaks. Food price rises slowed to 2.2% in 2024-25 and 4.3% in 2025-26. Shoplifting still grew by 16% and then 19%. Prices did not fall back; they just stopped rising as fast. Households still pay far more than in 2021, which could keep shoplifting high. It is harder to see why that alone would keep it speeding up.
About 7,900
more shoplifting crimes in 2025-26 than food prices alone would predict
Predicted about 45,500 · recorded 53,369 · based on the pattern from 2013-14 to 2023-24
Two other signs of hardship eased over the same years. Crisis Grant applications, the emergency cash councils give people with no money for essentials, peaked at 291,585 in 2022-23. There were 258,490 in 2025-26. Trussell food banks in Scotland gave out 218,838 food parcels in 2025. That is 13% fewer than in 2024 and 8% fewer than in 2019. Scotland is the only part of the UK below its 2019 level. Neither measure is perfect: councils ration grants, and some people now use other food aid. But neither shows hardship getting worse over the last two years.
Shoplifting was already creeping up before prices rose
Between 2013-14 and 2018-19, shoplifting grew by about 900 crimes a year. If that trend had simply carried on, we would expect around 37,400 in 2025-26. The real figure is about 16,000 higher.
Are shops just reporting more?
Some of the latest rise probably is more reporting. The Scottish Government funds the police Retail Crime Taskforce, which started in April 2025 and works mainly in Edinburgh, Glasgow and Lanarkshire. In the Scottish Grocers' Federation's yearly survey, the share of shops saying they were unlikely to report shoplifting fell from 48.2% to 10.9%. A Police Scotland inspector said the latest increase is “perhaps not reflective of a huge increase in offences”.
But reporting cannot explain all of it. Edinburgh and Glasgow were already rising fast in 2024-25, before the taskforce began. In 2025-26 the rest of Scotland, outside the taskforce areas, still rose 16%. And North and South Lanarkshire, both taskforce areas, barely changed.
Who is responsible?
Policing, courts, prisons and criminal law in Scotland are run by the Scottish Parliament and the Scottish Government, not Westminster. The SNP has led the Scottish Government since 2007. The early release schemes, the sentencing rules and police funding in the timeline above are all Scottish decisions. The UK Labour government, elected in July 2024, runs policing in England and Wales only.
Labour's Crime and Policing Act 2026 scraps England and Wales's £200 rule and creates a new offence of assaulting a shop worker. None of it applies in Scotland, and those parts were not yet in force when we checked. Scotland's own shop worker protection law dates from 2021. The timing matters too: Scotland's biggest jumps, in 2022-23 and 2023-24, came before the change of UK government.
So what is driving it?
No single cause fits every fact. Our best reading of the evidence:
- The cost of living crisis fits the timing of the biggest jumps, in 2022-23 and 2023-24, very closely.
- A falling chance of being caught and fits too. It started before the price rises and carried on through them.
- More reporting explains part of the latest increase, especially in 2025-26.
- Organised gangs and addiction are named by police and retailers. No reliable figures split the rise between people stealing to eat, to sell on or to fund a habit.
What the figures can and cannot prove
- They can show that recorded shoplifting is at a record high, higher per person than England and Wales, while other theft is falling.
- They can show that the rise tracked food price rises closely until 2024, and that far fewer shoplifting crimes now end in a .
- They cannot say why any one person stole. Crime figures count crimes, not reasons.
- They cannot fully separate a real rise from more reporting.
- Our tests use 11 years and 32 councils. Those are small numbers, so we treat the results as evidence, not proof.
Why food still costs so much
Food price rises have slowed, but prices have not come back down. See what happened to the cost of a weekly shop and why.
Read why food prices stay highYou can download our council-by-council table of shoplifting, other theft, break-ins, Crisis Grant applications and child poverty from 2013-14 to 2025-26. Every figure comes from the official sources listed below. The tests and predictions are our own and are labelled as such.